View MBG Metrics
The Metrics page contains a collection of data and statistics
pertaining to the system.
Viewing the Metrics
To view MBG system metrics:
- On the MBG main page, click the System
tab, and click Metrics.
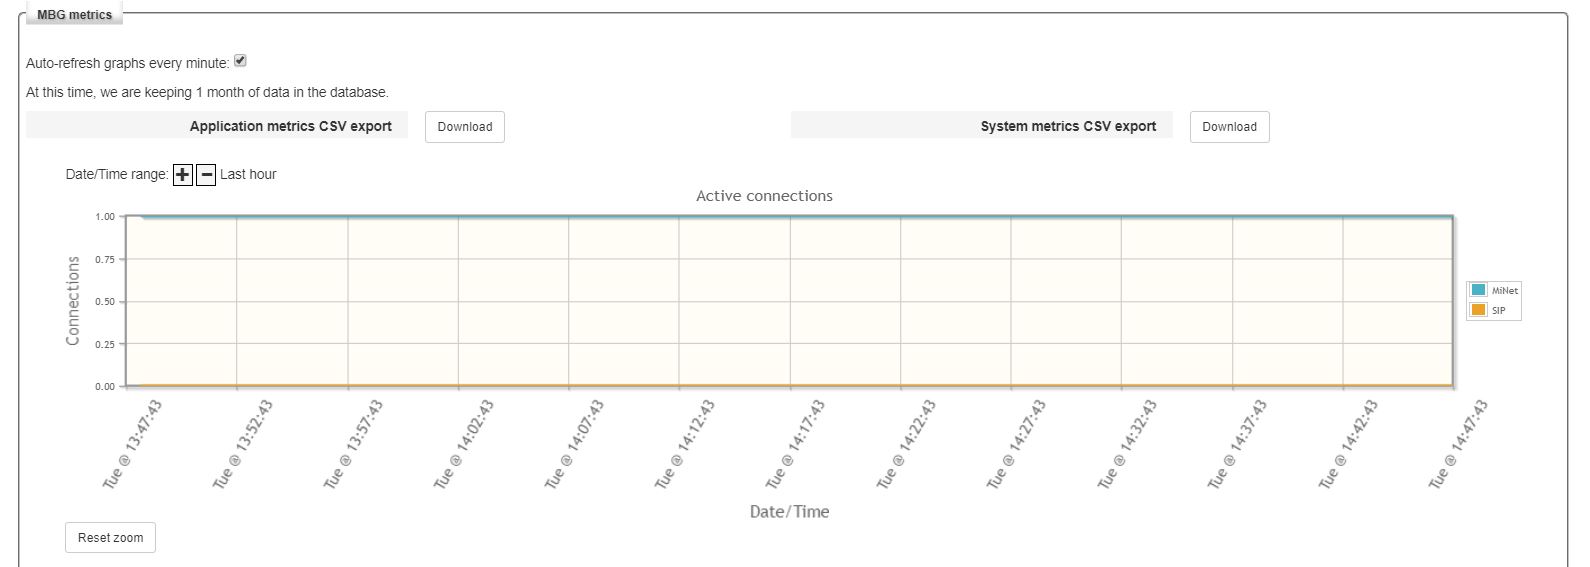
Information is displayed in graphical format for seven
different system functions. Using the screen tools, you can Change
the Date/Time range and Zoom in to view data in detail for each function.
Changing the Date/Time Range
By default, one hour's worth of data is displayed for
each graph. You can change this to display data for the last day,
week, month or year.
To change the Date/Time range for any graph:
- Click the
 sign to shrink
the reporting interval.
sign to shrink
the reporting interval.
- Click the
 sign to expand
the reporting interval down.
sign to expand
the reporting interval down.
Zooming in to Data
You can zoom in to a particular spot on a graph in order
to examine the data more carefully.
To zoom in to data for any graph:
- Hold down the left button on your mouse to select
the data you wish to view in detail. When you release the mouse
button, the graph will be resized to display the data you have
selected.
- To return the graph to its regular view, click Reset
zoom. The graph will display data for a complete hour, day, week,
month or year.
Updating the Auto-refresh Setting
By default, the metrics data is refreshed every minute.
You can disable this functionality so that the information remains
unchanged while you are viewing the MBG metrics screen.
To update the auto-refresh interval:
- Select Auto-refresh graphs every minute to cause
the data to be refreshed automatically.
- Clear Auto-refresh graphs every minute to cause
the data to remain unchanged. Note that if you exit and return
to the Metrics screen, the “auto-refresh” setting will be enabled
again.
Using MSL System Monitoring to View
Metrics
You can also view metrics that apply to the MSL operating
system using the “System monitoring” option in the server manager
menu. To access this information, click the System monitoring link.
Exporting Application Metrics
To export application-level metrics to a CSV file:
- On the MBG main page, click the System
tab and click Metrics.
- Click Download beside
App metrics CSV export.
- Click Save.
- Navigate to the folder where you wish to store the
file, and click Save.
- Open the file using a CSV-compatible application
such as Microsoft Excel®.
Exporting System Metrics
To export system-level metrics to a CSV file:
- On the MBG main page, click the System
tab and click Metrics.
- Click Download beside
System metrics CSV export.
- Click Save.
- Navigate to the folder where you wish to store the
file, and click Save.
- Open the file using a CSV-compatible application
such as Microsoft Excel®. Information is displayed in graphical
format for the following system functions and activities:
- License usage
- Active calls
- Calls per hour
- TUG memory
- Event daemon memory
- TUG cpu
- Event daemon cpu
- Disk usage (%)
- Load average