Active Calls
The system allows you to view information about conferences that are in progress. The call information page is updated according to the refresh rate that is selected at the top of the screen. The default refresh rate is every 30 seconds.
View active conference calls
From the MiCollab Audio, Web and Video Conferencing main page, click Active Calls from the navigation pane. The page shows a conference call in progress and the participants.
- While monitoring live conferences, you can perform the following operations:
End Call: Ends the conference without any warning or notice to conference participants.
Drop Leg: Drops this participant from the conference without any warning or notice to the participant.
- Collect Call Quality Data: Collects call quality data for support purposes. The call must active for at least one minute or no data is collected.
- Click Collect Call Quality Data link for the conference that you want to collect call quality information. The call must be up for one minute or no data is collected.
- Click DownloadDataCapture option.
- At the prompt, click Save, and then choose a location to save the file.
Analyze call quality data
For Wireshark versions 1.0 and
1.1:
- Unzip the downloaded call quality data file.
- Two types (info file and a monitor file) of files are captured in thecall quality datafile. Open the monitor file in Wireshark.
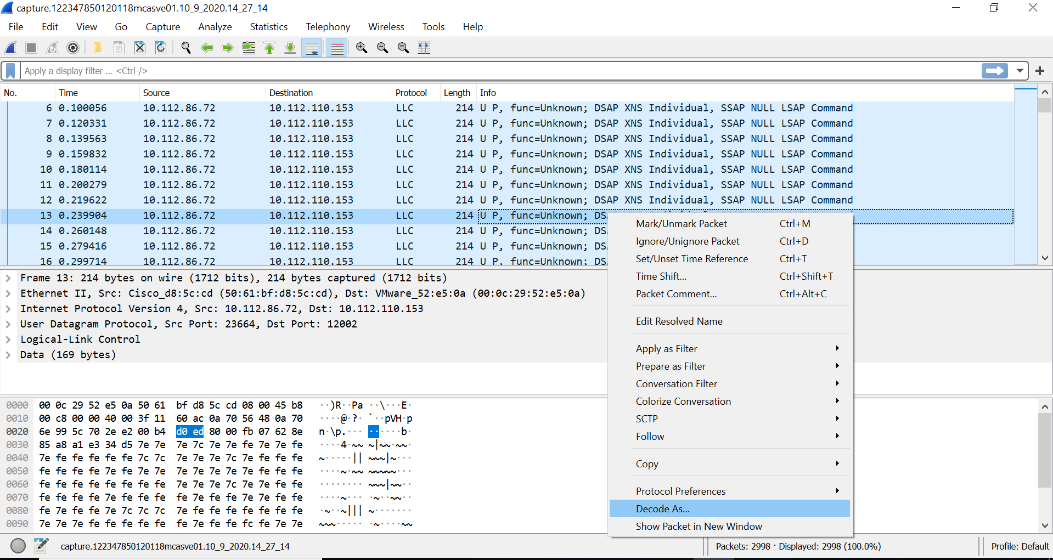
- Wireshark will show the trace as UDP.
To convert UDP trace to RTP:
- Right-click a packet and select Decode As.
- Set to RTP.
Perform the above procedure for the reverse stream also.
- Once all packets are displayed as RTP,
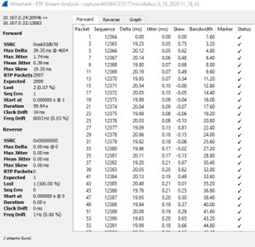
select Telephony > RTP>Stream Analysis.
VQ analysis with Jitter and bandwidth data is displayed.
For Wireshark version 3.2.2:
Use the following
procedure to decode UDP packet into RTP.
- Wireshark will show the trace as UDP.
We need to convert this into RTP, right click on a packet and select
decode as option.
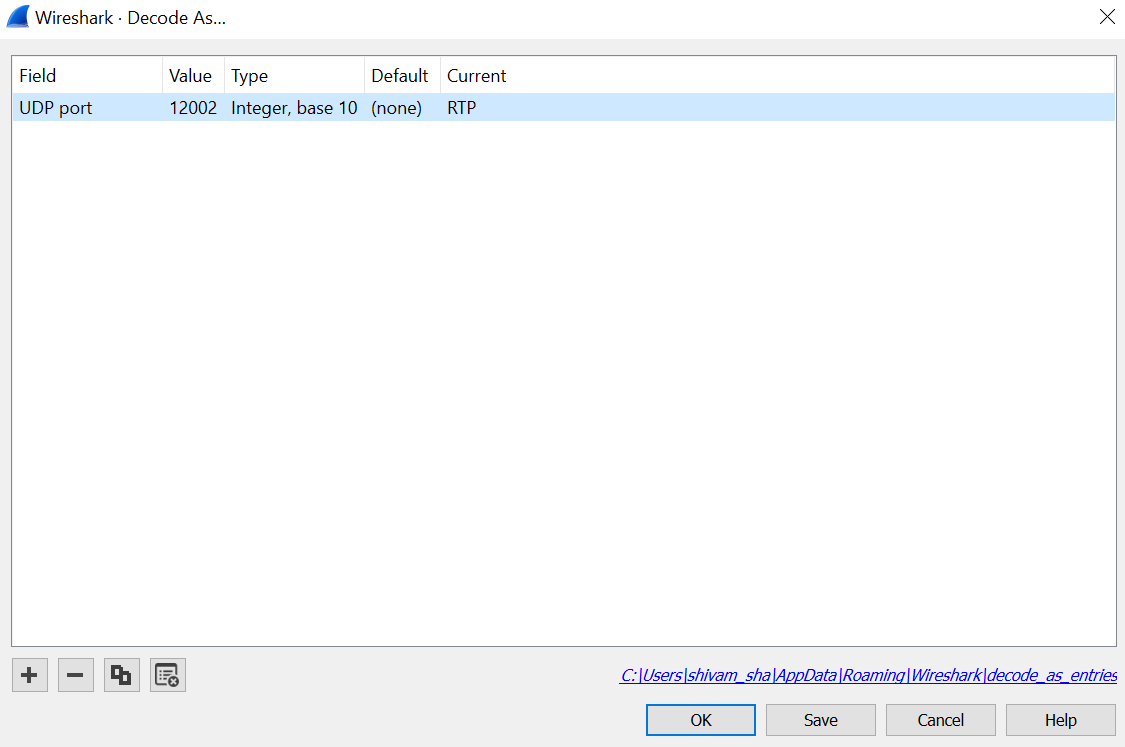
- Decode
As window prompt will open. Set the following options to decode
the packet in RTP and select OK:
- Field: UDP Port
- Value: 12002 Port Number(DST Port)
- Type: Integer, base 10
- Default: none
- Current: RTP
- Once all packets are displayed as RTP select Telephony > RTP>Stream Analysis.
- This will then open a VQ analysis which
shows Jitter and bandwidth.

↑