Debug
After creating a workflow, you can enable debug to ensure the flow works as expected.
- On the Workflow Canvas page, click the Debug tab to access the workflow debugger.The Debug Mode pane is displayed on the right side.Figure 1. Debug
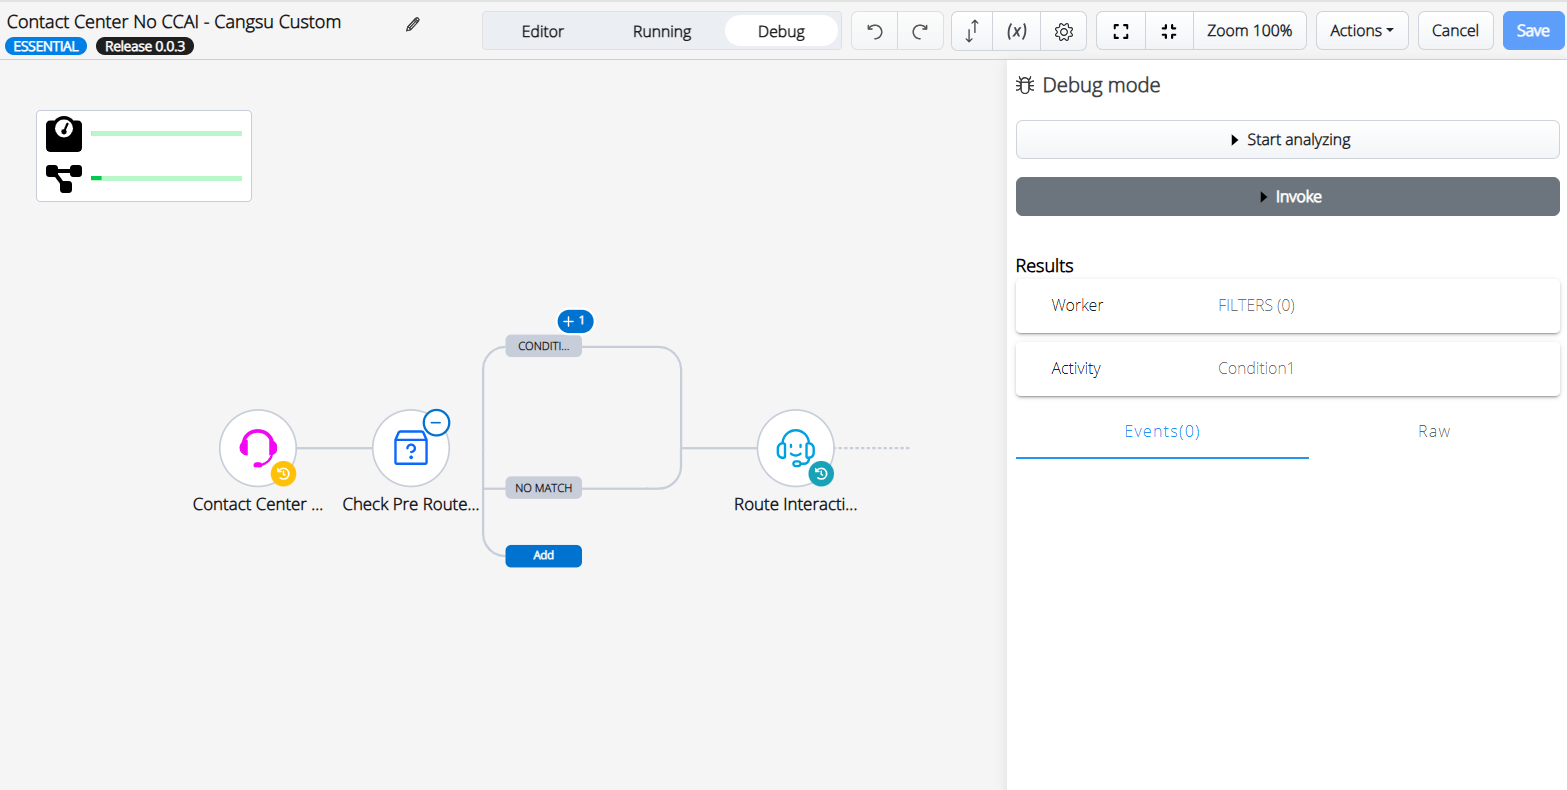
- Select Start analyzing to begin analyzing and debugging the selected workflow.
The Debug information for each activity is displayed when your workflow is triggered.
For example,
- If your workflow begins with an Endpoint Ringing trigger, the workflow executes once the call is received from the selected endpoint.
- If your workflow begins with a Webhook trigger, click Invoke to execute the workflow. This will display a form where you can enter any input variables passed to your workflow when it starts.
- If there are no input variables, click Run on the form to trigger the workflow.
Figure 2. Debug mode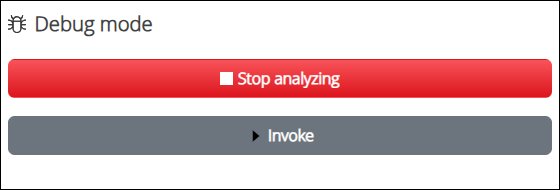
Once each activity is executed, a circled number appears with the total execution count. If the activity contains an error, the circle will be displayed in red.
Figure 3. Circle Numbered Activities Sample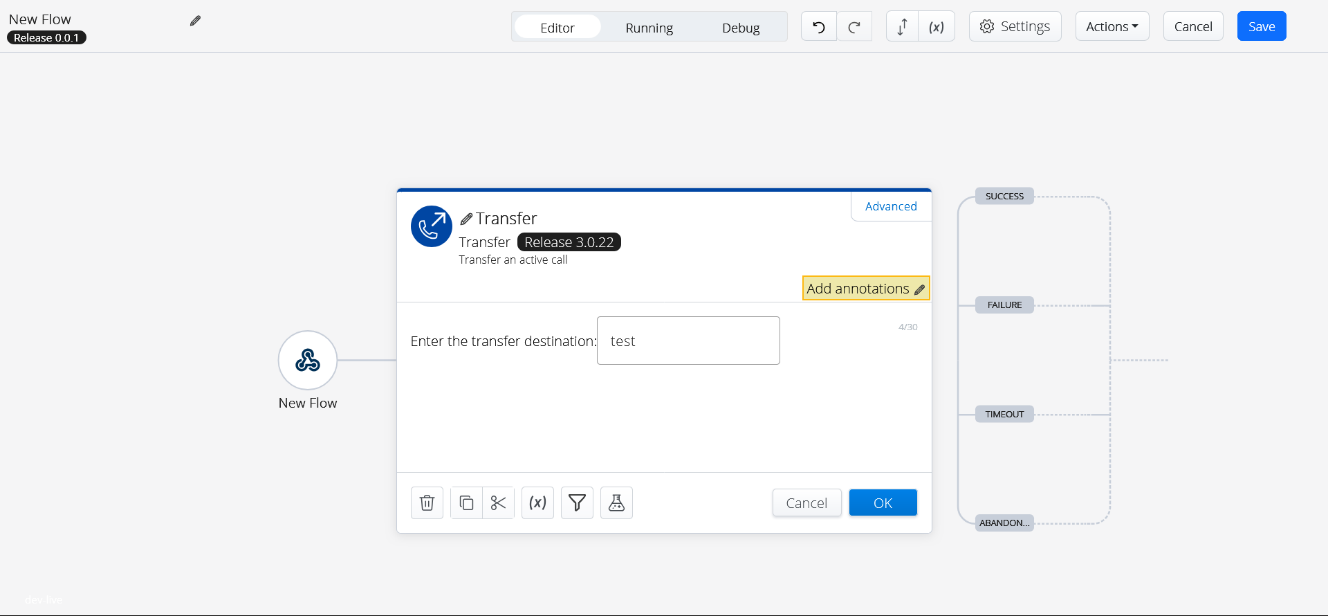
- After the workflow is complete, click Stop analyzing to stop the debugger and analyze the data from the workflow execution.
The Debug mode pane is displayed with the Results section.
Figure 4. Debug mode - Results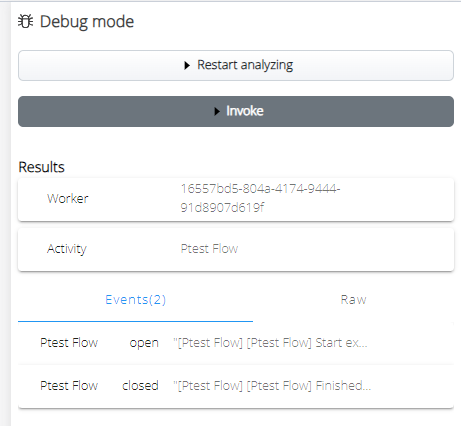
For more information on the fields, refer to the following table below.
Table 1. Debug Results – Field Description Field Description Worker
Displays the worker ID that executed this instance of the workflow. This is helpful when contacting Mitel support for further assistance or to look up additional information about the workflow's execution.
Results
Events
Displays the information for each activity executed in the workflow. It is used for analysis.
Each activity that is executed will have an Open and a Closed event.
Raw
Displays the HTTP messages received by the activity. It helps to see error messages or other detailed information returned in response.
- Click on the circled number on the activity to view more details.
The Debug mode pane is displayed with the activity details.
If the event type is Open, the Events section is displayed with all the input and throughput arguments of the activity.
Figure 5. Debug mode – Open Events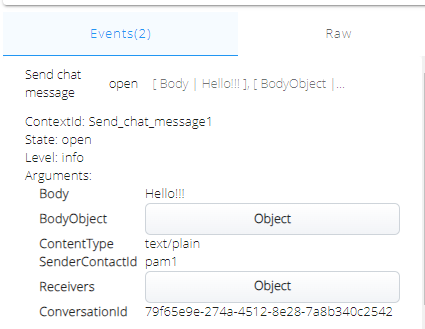
If the event type is Closed, the Events section displays all the output and throughput arguments of the activity.
Figure 6. Debug mode – Closed Events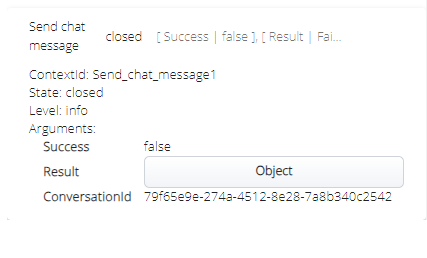
This information can be used to validate that each activity was executed as expected, and if not, it can be analyzed further.
- Click Object to view the details of the argument.
Debugging Multiple Activities:
You can also debug the workflow and its activities simultaneously. For example, if you debug the workflow and find that one of the activities contains an error, you can debug that activity at the same time as the workflow to obtain further information.
To debug an activity in a workflow, perform the following steps:
- Click on the activity in the main workflow.
- Click the Advanced tab.
The Activity Identifier is displayed below.
Figure 7. Activity Identifier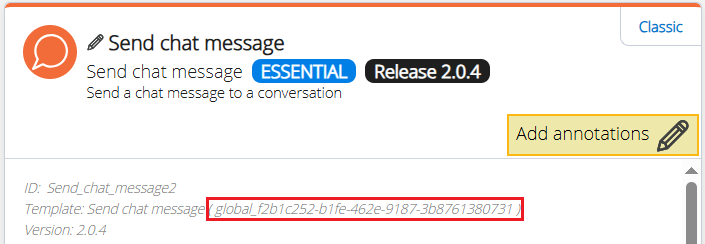
- Click on the activity identifier to open that activity in a new browser tab.
- In the Workflow canvas, click Debug.
- Click Start analyzing.
- Navigate to the main workflow and click Start analyzing.
When your workflow begins executing, the debug information is gathered for the main workflow and the selected activity.
- Click Stop analyzing on both the main workflow and the selected activity tabs to stop debugging.Note: To debug one of the activities, the main workflow must be in active debug mode; it is impossible to start debugging the activity without debugging the main workflow.
This process can be repeated with multiple activities in the workflow simultaneously, so if any activity needs further detail, it can be debugged simultaneously with the main workflow.