Running
The Running view shows all workflow instances that are currently running or have recently stopped. It is used to detect indefinitely running workflow instances and force them to stop. It also allows administrators to review the execution details of completed workflow instances using the Debug (![]() ) icon. This view provides retrospective debugging so administrators can analyze workflow behavior without reproducing the original conditions.
) icon. This view provides retrospective debugging so administrators can analyze workflow behavior without reproducing the original conditions.
Investigate reported customer issues
Understand why a specific instance reached a Terminate or Cancelled state
Validate variable values and routing decisions taken during execution
Compare past runs to identify patterns or recurring failures
Debug externally triggered workflows (e.g., webhook events or API calls) that are difficult to reproduce
- On the Workflow Canvas page, click on the Running tab.
The Running view is displayed with empty data.
- Select a time range from the drop-down list to filter the workflow instances for the selected time range.
The list of running or recently stopped workflows is populated with the workers.
Figure 1. Workflow Canvas – Running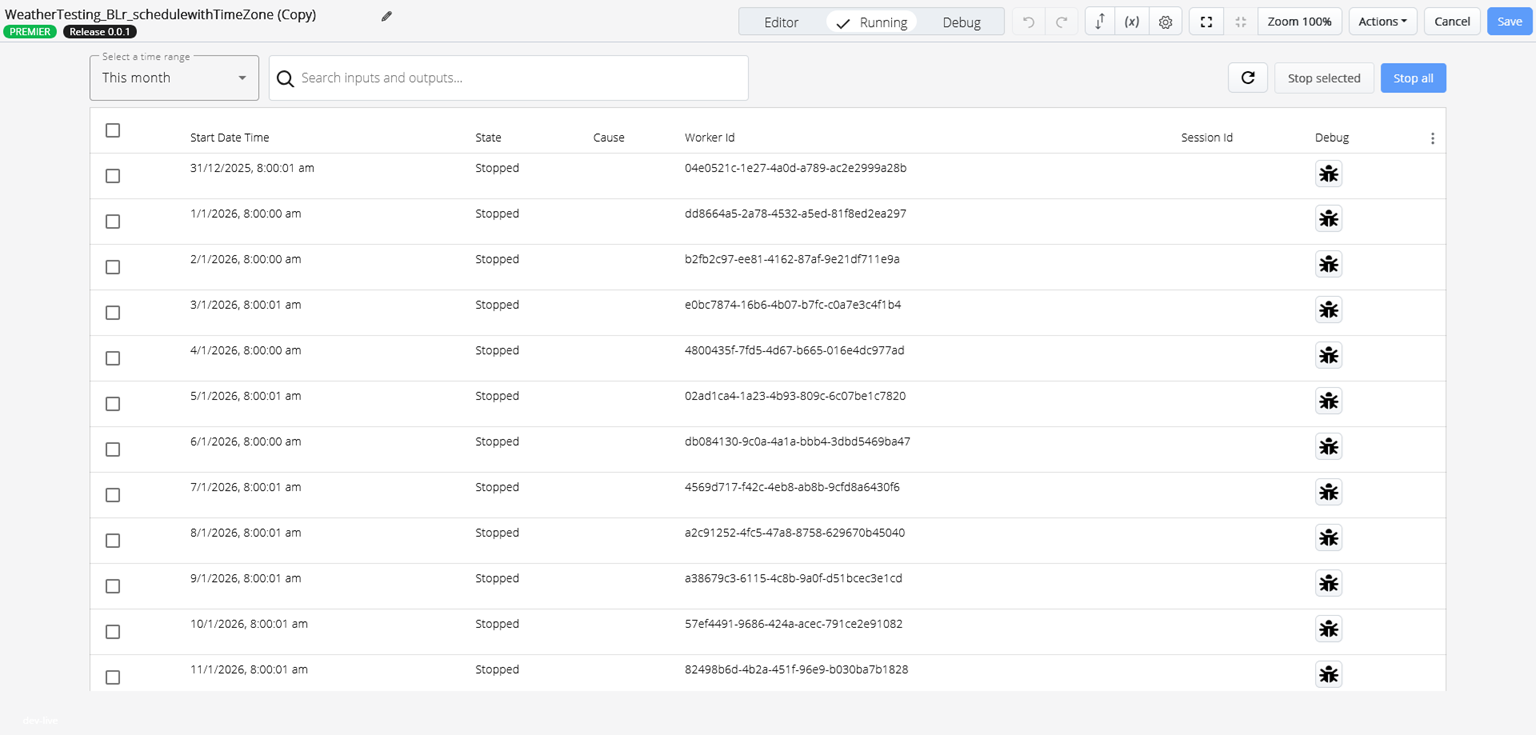 For more information on columns, refer to the following table.
Table 1. Running View – Column Description Columns Description Start Date Time
Displays the date and time that the workflow instance began running.
State
Displays the current state of the workflow instance.
The available options are:
- Running: The workflow instance is actively running
- Bookmarked: The workflow instance is waiting at a Bookmark activity
- Cancelled: The workflow instance was terminated by an external request, such as stopping it from the Running view
- Stopped: The workflow instance stopped normally
Cause
Displays the reason for the current state, if any. This is generally populated with the Reason value in a Terminate action. It allows you to see why the workflow ended if a Terminate action is used to end the workflow.
Worker ID
Displays the unique identifier assigned to the instance of the worker.
Session ID
Displays the unique identifier assigned to the session.

Click this icon to debug previously run flows to help troubleshoot issues and/or gain a better understanding of how these flows are executed.
- In the Search field, enter a value to find a specific workflow instance. The system compares the entered value against all input and output variable values in each workflow. The workflow list is filtered to display only the matching results.
Example: If a caller's number is an input variable, entering 12345 will match a variable value such as
+15551234567. - Click on the three dots (
 ) icon to filter the columns displayed in the table.Figure 2. Running – Filter Parameters
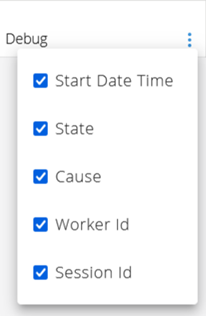
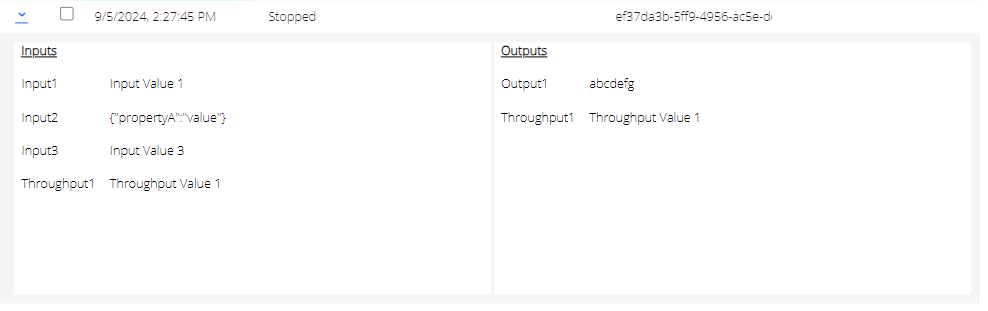
- Click on the respective workflow instance row to view the input and output variables.Figure 3. Running - Inputs/Outputs Variables
-
Click on the Debug (
) icon next to the selected workflow instance.The Debug Mode pop-up screen is displayed, similar to the standard Debug tab described in the Debug section.
Figure 4. Debug Mode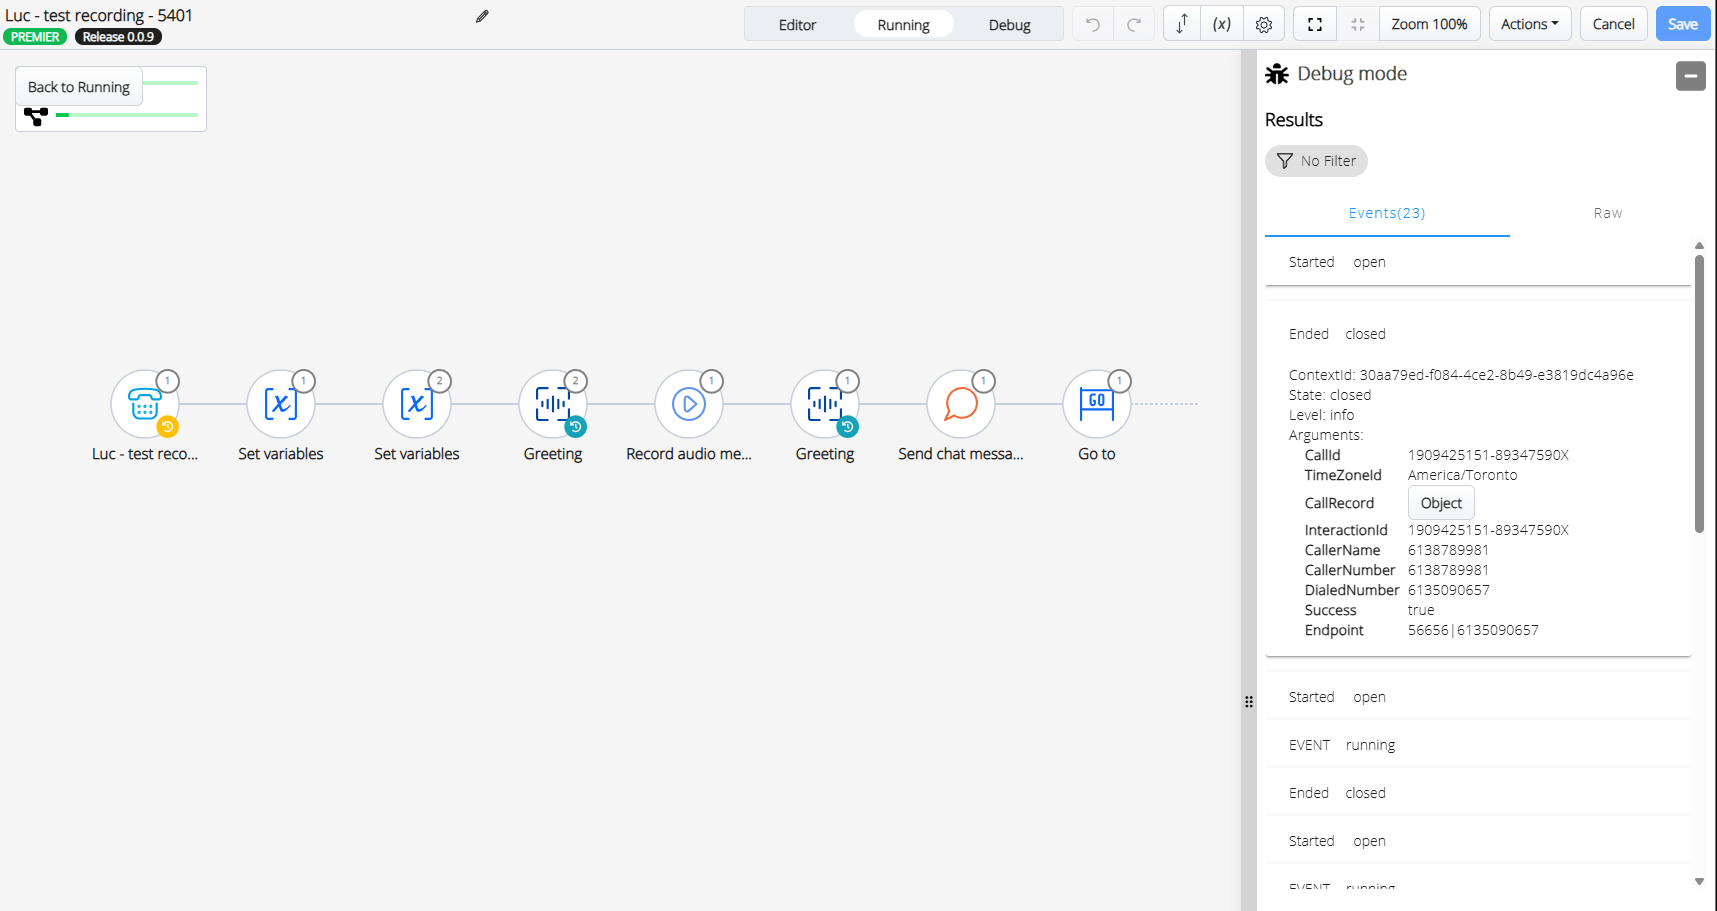 For more information on the debugger interface, refer to the following table.
Table 2. Debug Mode - Interface Description Interface Description Results panel
Displays the sequence of events, identical to live debugging.
Events tab
Displays the Open (inputs) and Closed (outputs) arguments for each activity.
Raw tab
Displays the raw transport-level logs (HTTP messages, payloads, etc.)
Execution Counters
Each activity icon displays a circled number indicating how many times it has been executed.Note:Red circles indicate errors encountered during that activity.
The following complete recorded execution data is displayed for the selected workflow instance.-
All Events (Open/Closed) for each activity in the workflow.
-
All input, throughput, and output argument values.
-
Any errors, exceptions, or Terminate reasons encountered.
-
The exact execution order of activities, including repetitions and loops.
-
The full Raw data for each activity, including HTTP requests/responses when applicable.
Note: This data format is identical to the live debugger based on historical execution logs rather than a real-time run. -
Running View - Basic Actions
| Buttons | Description |
|---|---|
|
|
Click this button to refresh the page for the currently selected time range.
Note:
The table will not automatically update. To see changes in workflow instances, you must either use the Refresh button or select another time range. |
|
|
Click this button to stop the selected workflow instance(s). This button is enabled only when one or more rows are selected, and the workflow instance is in the Running state. |
|
|
Click this button to stop all the workflow instance(s). This button is enabled only when one or more workflow instances are in the Running or Bookmarked state. |